Reviewing Results
2012
In this overview, you learn how to view patient results in the chart.
To take a closer look at the patient’s flowsheet, click the Measurements and Weights header from the Inpatient Summary to navigate to the Results/Flowsheets view menu section.
The Results/Flowsheet menu section displays all clinical information recorded for a person, not just labs but any result such as vitals, radiology reports, and documentation by multiple clinicians appear here. The flowsheet makes finding clinical information as efficient as possible. Information is shown in a spreadsheet with flexible display features that make it possible to create an optimal view.
You can narrow the information you need by clicking one of the flowsheet specialty tabs. A “Result” can be defined as any info entered into a patient’s chart. Double-click a result to view details.
The next several tabs are a subset of data from the All Results Flowsheet. Notice the division of the remainder of the flowsheet tabs mimics the organization of a paper chart.
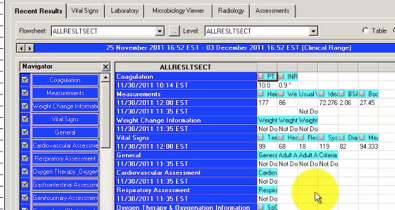
The flowsheet is divided into two major sections. The left section is the Navigator. By selecting a category, you can zoom immediately to its contents, which are displayed as values in the grid on the right. The right section is the Results display. You can control both sections in the way best suited to get to needed information quickly.
Results display as shown:
-
•Critical values in red
-
•Results of measurement in the cell
-
•Correction indicator (c) in the cell that contains modified data
-
•Comment indicator * in the cell that contains a result with written comments attached
-
•The legend can be found by selecting Result Legend from the Options menu
Double-clicking a result will view the result’s details, such as History, Reference Range, Performed by, etc.
The information bar displays the date and time range for which results are viewed.
Often physicians cannot find the result they are looking for. In more cases than not, changing the search criteria bar brings the missing results into view.
In order to change the search criteria:
1. Right-click the information bar to display the Search Criteria menu.
2. Select Change Search Criteria.
The Search Criteria window offers several options to customize the results being displayed.
-
•Clinical Range - Displays results with an occurrence time within the specified time range.
-
•Posting Range - Displays results that have posting times within the specified time range.
-
•Results Count - Allows you to select the specific number of latest entries to the patients’ chart to be displayed from 1–1,000.
-
•Admission Date to Current Date - View all results posted for the selected patient from admission date to current date.
3. Select Admission Date to Current Date.
4. Click OK to retrieve results in the chosen range.
Note: Changing the search criteria only affects the flowsheet you are currently viewing. If you select to view another flowsheet the defaulted timeframe appears, 48 hours pre-admit to current date.
Click to return to the Inpatient Summary menu section.
You have completed this overview; please click Next to proceed to the next lesson.
06 Results
11:21 AM
PowerChart offers a simple, intuitive visual interface that is designed by clinicians, for clinicians, working in both acute care and ambulatory settings.

